Optimize your warehouse layout with the ABC analysis
Warehouse staff in webshops walk a lot. If you want to work faster, you need to reduce the distance you walk. A smart warehouse layout can help with that. With an ABC layout, you organize your warehouse so that the products you pick most often are placed in the most accessible locations.
What is an ABC layout?
An ABC layout categorizes your products into three groups. Category A contains the small group of products you sell the most—your top sellers. Category B contains the larger group of products you sell moderately often. Category C contains the largest group of products you sell the least—the long tail.
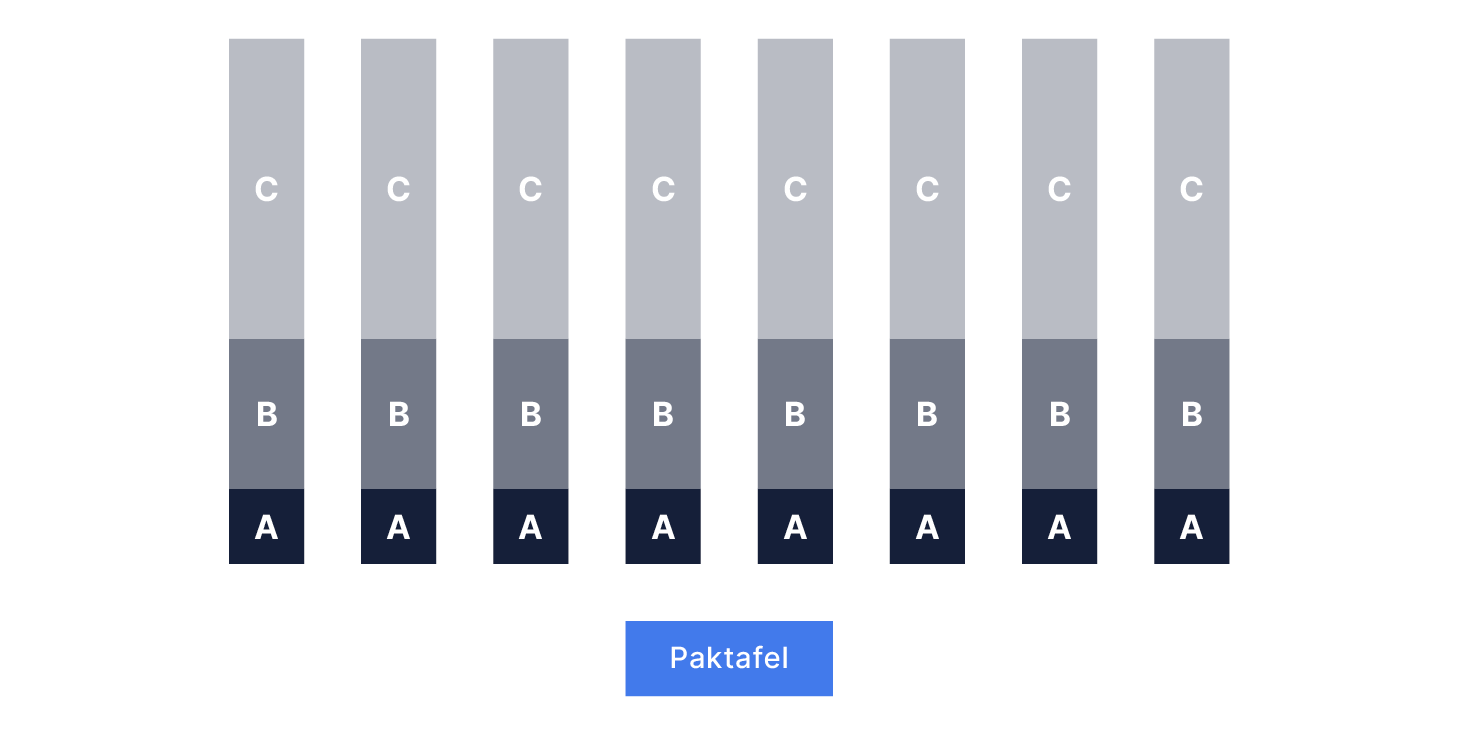
In an ABC layout, you place A-products as close to the packing table as possible. This way, you reduce the amount of walking. B-products are placed slightly further away. C-products go in the locations that require the most walking. Spread A-products across multiple aisles around the packing table so pickers don’t get in each other’s way.
How do you determine your ABC products?
An ABC analysis helps you determine which products belong in each category. It divides your assortment into three groups based on sales volume. You can use different metrics for this. To optimize your warehouse layout, look at how often products appear in picklists instead of total sales or revenue. That tells you how often you need to walk to a product’s location and how much time you can save by placing it closer.
In Picqer, you can do this using the ABC analysis. The analysis automatically assigns each product an A, B, or C label. Based on this, you can place your products in the most efficient location in the warehouse.
How many products fall into each category depends on several factors, such as the size of your warehouse, the dimensions of your products and bins, and the size of your assortment. In Picqer, we use the following breakdown:
- A-products: the top 5% most picked products
- B-products: the next 15% after the A-products
- C-products: the remaining 80%, which are picked the least
Product sales volumes can fluctuate throughout the year. Product life cycles, seasonal trends, and other changes all affect your data. That’s why it’s important to run your ABC analysis regularly. Picqer runs the analysis automatically every week, looking back over the past 28 days.

